

Contents
- Supply and Demand 📈📉
- Understanding the Market 🛒
- Law of Demand 🔻💰➡️📈
- Law of Supply 🔺💰➡️📦
- Market Equilibrium: Price Setting ⚖️💵
- Uses of Supply and Demand 🧰
- Elasticities in Supply and Demand 🧮📊
- Price and Resource Allocation 💸⚙️
- Role of Prices in the Economy 🏛️💬
- Allocation of Resources through Market Prices 📦➡️📈
- Concept of Opportunity Cost and Resource Optimization 🧠💡
- Price Signals and Incentives: Adjusting Production and Consumption 📊📣
- Elasticity 🔁📈
- Price Elasticity of Demand (PED) 🛍️💸
- Price Elasticity of Supply (PES) 🏭📦
- Income Elasticity of Demand (YED) and Cross Elasticity (XED) 💰🔄
- Factors Affecting Elasticity 📊⚖️
- Elasticity in Business Decisions 💼📉📈
- Market Structures 🏪📊
- Types of Market Structures 🧱🏭
- Characteristics and Performance of Each Structure 📊📋
- Effects of Market Structures on Pricing and Resource Allocation 🧮🗂️
- Efficiency and Welfare Implications of Different Market Types ⚖️🏆
- Trade and Welfare 🌍💱
- Importance of Trade 🌐🔄
- Benefits of Trade: Comparative Advantage and Specialization 🔍🎯
- Consumer Surplus, Producer Surplus, and Total Welfare 💰💡
- Government’s Role in Trade Rules 🏛️📜
- Effects of Free Trade vs. Protectionism ⚖️🌐
In this post, notes of “Unit 2: How Markets Work” from “DSC 1: Introductory Microeconomics” are given which is helpful for the students doing graduation this year.
Supply and Demand 📈📉
Understanding the Market 🛒
- The market shows how supply (👨🌾 sellers) and demand (🧍♂️ buyers) work together to set prices.
- Buyers and sellers act in their own interest, and prices change to match how much people want to buy with how much is available.
Law of Demand 🔻💰➡️📈
- Definition: When the price of a good goes down, people usually want to buy more of it, and when the price goes up, they buy less.
- 📌 Factors Affecting Demand:
- 💵 Income / How much money people have
- 🔄 Prices of related goods
- ❤️ Preferences / People’s likes and dislikes
- 🔮 Expectations about future prices
- 👥 Number of buyers
- 🔄 Changes in Demand:
- 📉 Movement along the curve: happens when the price of the good changes.
- 📊 Shift of the curve: happens when something other than price changes (like income or tastes).
Law of Supply 🔺💰➡️📦
- Definition: When the price of a good goes up, sellers usually supply more of it, and when the price goes down, they supply less.
- 📌 Factors Affecting Supply:
- 🏗️ Costs of making the product (like wages and materials)
- 🤖 Technology
- 🧑💼 Number of sellers
- 🔮 Expectations about future prices
- 🏛️ Government rules (taxes, subsidies)
- 🔄 Changes in Supply:
- 📉 Movement along the curve: happens when the price of the good changes.
- 📊 Shift of the curve: happens when something other than price changes (like production costs).
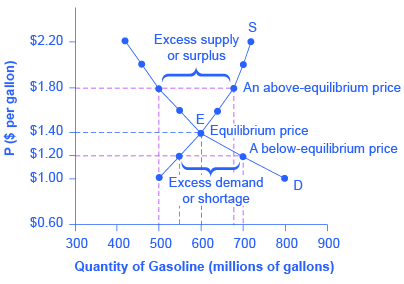
Market Equilibrium: Price Setting ⚖️💵
- Equilibrium price: the price where the amount people want to buy = amount available.
- 📦 If the price is too high, there’s a surplus (more supply than demand).
- 🧍♂️ If the price is too low, there’s a shortage (more demand than supply).
- 📉 The market naturally adjusts by changing prices to reach this balance.
Uses of Supply and Demand 🧰
- ⚠️ Price Controls:
- ⛔ Price Ceiling (like rent limits): maximum price allowed → can cause shortages.
- ✅ Price Floor (like minimum wage): minimum price allowed → can cause surpluses (like unemployment).
- 🕳️ Government actions can lead to black markets or lost efficiency.
Elasticities in Supply and Demand 🧮📊
- 📐 Price Elasticity of Demand (PED): measures how much quantity demanded changes with price.
- ⚡ Elastic demand: PED > 1 (luxuries, many substitutes)
- 🪨 Inelastic demand: PED < 1 (necessities, few substitutes)
- 📏 Price Elasticity of Supply (PES): measures how much quantity supplied changes with price.
- More elastic if it’s easy for producers to increase output.
- 💼 Practical Uses:
- Helps businesses set prices 📊
- Governments can predict effects of taxes or subsidies 🏛️
- Elasticities influence total sales and tax burden 💸
Price and Resource Allocation 💸⚙️
Role of Prices in the Economy 🏛️💬
- Prices send messages to buyers and sellers in the market.
- They help answer the three basic economic questions:
- ❓ What should we make?
- 🛠️ How should we make it?
- 🧍♂️ Who should get it?
- Prices help organize economic activity without a central plan — this is the invisible hand 🤲, a concept from Adam Smith 🧠.
Allocation of Resources through Market Prices 📦➡️📈
- Resources (land, labor, capital) are limited ⚠️.
- Markets direct resources to where they are needed most.
- 📈 High prices → signal high demand or low supply → encourages producers to allocate more resources to that product.
- 📉 Low prices → signal lower value or surplus → fewer resources are used.
🧪 Example:
If electric car prices go up 🚗⚡, more workers and materials will be used to make electric cars due to high demand.
Concept of Opportunity Cost and Resource Optimization 🧠💡
- Opportunity Cost: the value of the next best alternative you give up when making a decision 💭💸.
- Every choice involves a trade-off 🔁.
- Resource Optimization: using resources where they are most productive and valuable ✅.
- Market prices help avoid wasting resources on things with less value.
🌾 Example:
A farmer choosing between corn 🌽 and wheat 🌾 will consider profits → the opportunity cost of planting corn is the profit lost from not planting wheat.
Price Signals and Incentives: Adjusting Production and Consumption 📊📣
- Price Signals:
- 📈 Rising prices → signal producers to produce more (profit 💰) and consumers to buy less (cost 💸).
- 📉 Falling prices → signal the opposite.
- Incentives:
- 🏭 Producers respond to profit potential.
- 🧍♀️ Consumers seek value and affordability.
- This system helps balance markets ⚖️ and ensures efficient resource use 🔧.
Elasticity 🔁📈
Price Elasticity of Demand (PED) 🛍️💸

- Definition: Shows how much the quantity demanded changes when the price changes.
- 📐 Formula:
")
- 📊 Types:
- ⚡ Elastic (PED > 1): Demand changes a lot (e.g., luxury items 💎)
- 🪨 Inelastic (PED < 1): Demand changes a little (e.g., necessities 🥖)
- ⚖️ Unit Elastic (PED = 1): Demand changes equally with price
- Perfectly Elastic: 🧍 Buyers react strongly (horizontal demand curve ➖)
- Perfectly Inelastic: 📉 Demand doesn’t change at all (vertical demand curve ⬆️)
Price Elasticity of Supply (PES) 🏭📦
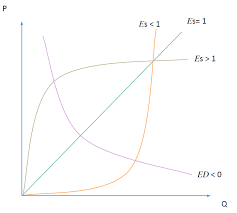
- Definition: Measures how much the quantity supplied changes when the price changes.
- 📐 Formula:
")
- 🔧 Uses:
- Elastic supply ➡️ Producers can adjust quickly
- Inelastic supply ➡️ (e.g., crops 🌾) means prices are more unstable
Income Elasticity of Demand (YED) and Cross Elasticity (XED) 💰🔄
📈 Income Elasticity of Demand (YED):
- Shows how demand changes with income changes.
- YED > 0: Normal goods (🍞 more demand as income rises)
- YED > 1: Luxury goods (💼 high-end items)
- YED < 0: Inferior goods (📦 demand drops as income increases)
- YED > 0: Normal goods (🍞 more demand as income rises)
🔄 Cross Elasticity of Demand (XED):
- Shows how demand for one good changes with the price of another.
- XED > 0: Substitutes (🥤 Pepsi ↔️ Coke)
- XED < 0: Complements (☕ coffee + sugar 🍬)
Factors Affecting Elasticity 📊⚖️
📦 For Demand:
- 🔁 More substitutes = more elastic
- ❤️ Necessity vs. Luxury
- 💰 Share of income spent on the item
- ⏳ Time — demand gets more elastic over time
🏭 For Supply:
- ⏱️ Time to react
- 🛠️ Flexibility in production
- 🧃 Spare capacity available
- 🧊 Storage options (perishable vs. durable)
Elasticity in Business Decisions 💼📉📈
- Total Revenue (TR) = Price × Quantity 💰
- If demand is elastic:
- ⬆️ Price → ⬇️ TR
- ⬇️ Price → ⬆️ TR
- If demand is inelastic:
- ⬆️ Price → ⬆️ TR
- ⬇️ Price → ⬇️ TR
📊 Businesses use PED to:
- Set optimal prices
- Plan sales/discounts
- Predict revenue changes from price adjustments
Market Structures 🏪📊
Types of Market Structures 🧱🏭
- Perfect Competition ⚖️🌾
- ✅ Many small companies
- 🔁 Same products
- 🚪 No barriers to enter/exit
- 💡 Everyone knows prices
- 💵 Firms are price takers
- 📍 Example: Crops like wheat or corn
- Monopoly 👑🚰
- 🏢 One company controls everything
- 🧬 Unique product (no substitutes)
- 🧱 High entry barriers (laws, cost)
- 🎯 Company sets the price
- 📍 Example: Local water or electricity services
- Oligopoly 🤝🚗📱
- 🏭 Few large companies dominate
- 🔄 Products can be same or different
- 🚧 High barriers to enter
- 🧠 Strategic behavior between firms
- 📍 Example: Car makers, smartphones, airlines
- Monopolistic Competition 🛍️🍔✂️
- 🧃 Many companies
- 🪄 Product differences (branding)
- 🚪 Low entry barriers
- 💬 Some price control
- 📍 Example: Clothing stores, restaurants, hair salons
Characteristics and Performance of Each Structure 📊📋
| Structure | 🏭 Number of Firms | 📦 Product Type | 🚪 Entry Barriers | 💰 Price Control | ⚙️ Efficiency |
|---|---|---|---|---|---|
| Perfect Competition | Many | Same | None | None (price takers) | ✅ Efficient |
| Monopoly | One | Unique | High | High (price maker) | ❌ Inefficient |
| Oligopoly | Few | Same/Different | High | Some | ⚠️ May be inefficient |
| Monopolistic Competition | Many | Different | Low | Some | 😐 Not fully efficient |
Effects of Market Structures on Pricing and Resource Allocation 🧮🗂️
- Perfect Competition:
- 💵 Price = Cost → ✅ Efficient resource use
- 🔄 Resources go where they’re needed most
- Monopoly:
- 💰 Price > Cost → ⚠️ Underproduction, inefficient use
- ♻️ Can waste resources
- Oligopoly:
- 🎲 Prices based on strategic choices
- ❗ May lead to collusion or price fixing
- 📉 Inefficient allocation is possible
- Monopolistic Competition:
- 💲 Prices are higher due to product differences
- 🏭 Some excess capacity → waste
Efficiency and Welfare Implications of Different Market Types ⚖️🏆
- Productive Efficiency (lowest cost production) 🏭✅
- ✅ Best in Perfect Competition
- Allocative Efficiency (right goods, right amount) 🎯📦
- ✅ Also best in Perfect Competition
- Monopoly & Oligopoly:
- ❌ Often not efficient
- 😟 Welfare loss (consumers pay more, get less)
- Monopolistic Competition:
- ➕ More choices
- ❌ May sacrifice efficiency
- ⚖️ Balance between variety and cost
Trade and Welfare 🌍💱
Importance of Trade 🌐🔄
- Trade allows countries to get goods and services they can’t produce efficiently on their own.
- It offers more choices, 💲 lower prices, and better resources or technology.
- In a market economy, trade spreads resources globally, not just within one country. 🌍
Benefits of Trade: Comparative Advantage and Specialization 🔍🎯
- Comparative Advantage: A country has a comparative advantage if it can produce something at a lower cost than others.
- Even if one country is better at everything (absolute advantage), both can benefit by focusing on what they do best.
- Specialization: When countries focus on their strengths and trade for other goods, global output increases. 🌱
Example:
- Country A can produce both wine 🍷 and cheese 🧀 more efficiently than Country B.
- But Country A sacrifices less wine to make cheese compared to Country B.
→ Country A specializes in wine, Country B specializes in cheese → both benefit from trade! 🌏
Consumer Surplus, Producer Surplus, and Total Welfare 💰💡
- Consumer Surplus (CS): The difference between what consumers want to pay vs. what they actually pay.
- Producer Surplus (PS): The difference between what producers earn vs. the lowest price they would accept.
- Total Welfare = Consumer Surplus + Producer Surplus
- Trade increases total welfare by:
- More CS (cheaper imports for consumers)
- More PS (larger markets for producers)
Government’s Role in Trade Rules 🏛️📜
Governments control trade for several reasons, including:
- Tariffs: Taxes on imports to protect local businesses 💵
- Quotas: Limits on imports 📉
- Subsidies: Financial support for local industries 💰
- Regulations & Standards: Health, safety, or environmental rules 🏥🌱
- Trade Agreements: Rules for international trade (like WTO, NAFTA) 🤝
Governments may limit trade to protect:
- 🧑💼 Jobs
- 🆕 New industries
- 🛡️ National security
- 🔑 Important resources
Effects of Free Trade vs. Protectionism ⚖️🌐
- Free Trade:
- Increases total welfare (more CS + PS) 💡
- Consumers enjoy lower prices and more choices 🎁
- Encourages new ideas and competition 🚀
- Some local industries may struggle, needing time to adapt ⏳
- Protectionism:
- Supports certain industries in the short term ⚙️
- Can lead to higher prices and fewer choices for consumers 💸
- Waste occurs due to inefficient resource use ❌
Graph Note:
- Before trade: Higher local prices
- After trade: Lower prices due to imports
- The gain: Increased consumer surplus outweighs the loss in producer surplus 📉📈
